Pipeline Catalog: Statistical Analysis
Differential Expression Analysis
One of the primary uses of bulk RNA sequencing data is to identify genes which are expressed at different levels between groups of samples. The three primary algorithms used for this analysis are DEseq2, edgeR, and limma-voom.
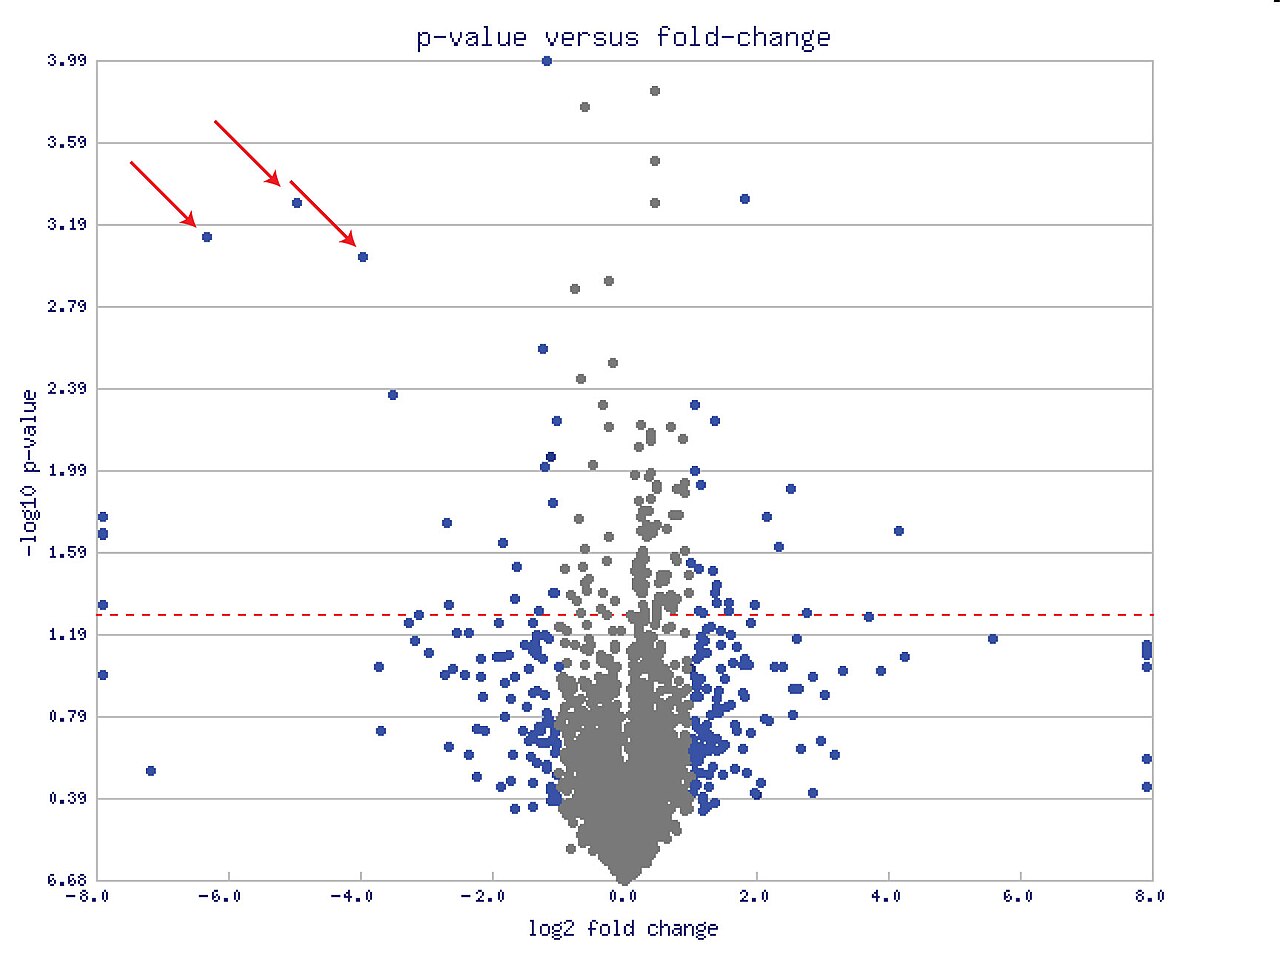 Image credit: WikiMedia
User Guide
To compare groups of samples on the basis of their metadata annotations, simply indicate which column in the sample metadata table should be used as the basis of comparison.
If the value in that column is numeric, then it will be treated as a continuous variable. If the value is categorical, then the user must also specify what the comparison value should be (against which all other values are contrasted).
The output of this analysis is a table of gene-level differential expression results, indicating the fold change in gene expression between sample groups as well as the FDR-adjusted significance of that difference.
Parameters:
- Gene Counts: Select the table which contains the expression values for each gene in the analysis
- Algorithm: Select the statistical method which should be used to identify significant changes in expression for each gene
- Comparison Value: Enter the name of the column in the sample annotation table which indicates the comparison to make, either a continuous or a categorical value
- Comparison References: In the case that a categorical variable was provided for the "Comparison Value", the user must specify the value in that column which should be treated as the control
- Batch Correction: Optionally indicate any columns in the sample metadata table which annotate analysis batches which should be adjusted for in the differential expression analysis
- Filtering: Optionally provide a boolean expression which is used to filter the set of samples included in the analysis (e.g.
colA < 2will exclude any samples which do not contain a value less than 2 in the column labeled 'colA')
Example 1 (Treatment/Control):
Consider the experimental design represented by:
| sample | cage | status |
|---|---|---|
| mouse1 | c1 | control |
| mouse2 | c1 | control |
| mouse3 | c1 | treatment |
| mouse4 | c1 | treatment |
| mouse5 | c2 | control |
| mouse6 | c2 | control |
| mouse7 | c2 | treatment |
| mouse8 | c2 | treatment |
To identify changes in gene expression in the treatment samples (relative to the control)
samples, while controlling for any difference between cages c1 and c2, the appropriate
parameters to use would be:
Comparison Value:statusComparison Reference:controlBatch Correction:cageFiltering:<blank>
Example 2 (Filtering):
Building from the example above, consider the scenario where two samples have been
determined to have failed quality control, and need to be excluded from the anlaysis.
To accomplish this, an additional column should be added (passing_qc), which is used
to annotate the samples as a boolean pass/fail (1/0), and filter out the failing samples
from the differential expression analysis
| sample | cage | status | passing_qc |
|---|---|---|---|
| mouse1 | c1 | control | 1 |
| mouse2 | c1 | control | 0 |
| mouse3 | c1 | treatment | 1 |
| mouse4 | c1 | treatment | 1 |
| mouse5 | c2 | control | 1 |
| mouse6 | c2 | control | 1 |
| mouse7 | c2 | treatment | 1 |
| mouse8 | c2 | treatment | 0 |
To identify changes in gene expression in the treatment samples (relative to the control)
samples, while controlling for any difference between cages c1 and c2, the appropriate
parameters to use would be:
Comparison Value:statusComparison Reference:controlBatch Correction:cageFiltering:passing_qc
Example 3 (Continuous Variable):
Instead of the treatment/control design above, consider the scenario where gene expression is being analyzed in comparison to a laboratory test for inflammation - C-reactive protein (CRP), and multiple samples have been collected from the same individuals over time:
| sample | PTID | day | CRP |
|---|---|---|---|
| p01_01 | p01 | 1 | 12.5 |
| p01_03 | p01 | 3 | 2.1 |
| p01_12 | p01 | 12 | 7.9 |
| p02_06 | p02 | 6 | 5.6 |
| p02_08 | p02 | 8 | 3.9 |
| p02_11 | p02 | 11 | 9.5 |
| p03_01 | p03 | 1 | 13.2 |
| p03_02 | p03 | 2 | 11.9 |
| p03_09 | p03 | 9 | 2.6 |
To identify changes in gene expression which are correlated with CRP levels (which in this case is a continuous variable), the appropriate parameters to use would be:
Comparison Value:CRPComparison Reference:<blank>(only needed for categorical variables)Batch Correction:<blank>orPTID(to optionally control for differences between participants)Filtering:<blank>
Workflow Repository: github.com/FredHutch/pw-differential-expression
Citations:
- DEseq2: Love MI, Huber W, Anders S. Moderated estimation of fold change and dispersion for RNA-seq data with DESeq2. Genome Biol. 2014;15(12):550. doi: 10.1186/s13059-014-0550-8. PMID: 25516281; PMCID: PMC4302049.
- edgeR: Robinson MD, McCarthy DJ, Smyth GK. edgeR: a Bioconductor package for differential expression analysis of digital gene expression data. Bioinformatics. 2010 Jan 1;26(1):139-40. doi: 10.1093/bioinformatics/btp616. Epub 2009 Nov 11. PMID: 19910308; PMCID: PMC2796818.
- limma-voom: Law CW, Chen Y, Shi W, Smyth GK. voom: Precision weights unlock linear model analysis tools for RNA-seq read counts. Genome Biol. 2014 Feb 3;15(2):R29. doi: 10.1186/gb-2014-15-2-r29. PMID: 24485249; PMCID: PMC4053721.
Gene Set Enrichment Analysis
Gene set enrichment analysis is performed to summarize the biological pathways which are commonly enriched or depleted in a collection of differentially expressed genes. The collections of genes which have been annotated by biological pathways can be found in the MSigDB. The Bioconductor package used to perform GSEA is fgsea.
The output of this analysis is a table indicating the enrichment scores associated with each of the hallmark gene sets in the MSigDB.
User Guide
Parameters:
- Gene Ranking Table: The input table must contain a ranking of genes by their enrichment score, with values for both gene score and p-value
- Gene ID Column Name: Indiciate the name of the column in the Gene Ranking Table which contains the Gene ID
- Gene Score Column Name: Indiciate the name of the column in the Gene Ranking Table which contains the Gene Score
- P-Value Column Name: Indiciate the name of the column in the Gene Ranking Table which contains the P-Value
Workflow Repository: github.com/FredHutch/pw-gene-set-enrichment
Citations:
- fgsea: Korotkevich G, Sukhov V, Sergushichev A (2019). “Fast gene set enrichment analysis.” bioRxiv. doi: 10.1101/060012, http://biorxiv.org/content/early/2016/06/20/060012.
Lymphocyte Quantification
Having estimated the relative gene expression from bulk RNA sequencing, it is possible to estimate the proportions of different cell types which are present in the source tissue sample. This analysis is based on a mixture modeling approach using prior knowledge of the genes which are typically expressed in different cell types. The quanTIseq method focuses on different subtypes of lymphocytes, estimating the proportion of macrophages, T-cells, B-cells, etc.
User Guide
The source code for quanTIseq is available at https://github.com/icbi-lab/quanTIseq, with more extensive documentation at https://icbi.i-med.ac.at/software/quantiseq/doc/.
Parameters:
- Gene Expression Table: The primary input for quanTIseq is a table with expression values for each gene, which defaults to the
salmon.merged.gene_tpm.tsvfile generated by the bulk RNAseq analysis workflow - Tumor Analysis: For samples generated from tumor specimens, selecting this option will use a tumor-specific prediction algorithm provided by quanTIseq
Workflow Repository: github.com/FredHutch/pw-bulk-rna-lymphocytes/
Citations:
- quanTIseq: Finotello, F., Mayer, C., Plattner, C. et al. Molecular and pharmacological modulators of the tumor immune contexture revealed by deconvolution of RNA-seq data. Genome Med 11, 34 (2019). https://doi.org/10.1186/s13073-019-0638-6
Relative Abundance Table
The core innovation of "omics" technologies is the ability to measure a large number of features in a single sample. Depending on the instrumentation being used, these features may be (to pick a few):
- Cell Types
- Metabolites
- Microbial Species
- RNA Transcripts
To help support a wide range of data sources, Cirro provides a general-purpose dataset type for relative abundance data. The purpose of this dataset type is to (a) help better catalog dataset collections and (b) provide access to analysis tools which use this type of data as input.
Requirements:
The general-purpose format expected for relative abundance data is:
- Comma-delimited table with the
.csvfile extension (or.csv.gz) - Rectangular table including a header row and index column
- Each column contains a sample (observation)
- Each row contains a feature (species, metabolite, gene, etc.)
- Each cell contains a numeric value (integer or float)
| index | sampleA | sampleB | sampleC |
|---|---|---|---|
| species1 | 0.1 | 0.08 | 0.15 |
| species2 | 0.85 | 0.72 | 0.68 |
| species3 | 0.05 | 0.20 | 0.17 |
Note: While the example table shows proportional values which add up to 1 for each sample, there is no such requirement or expectation for this data type.
Metadata:
It is strongly recommended to include a metadata table along with the relative abundance table. The only requirements for the metadata table is that it:
- Is named
samplesheet.csv - Uses a header row
- Contains a
samplecolumn with values matching the relative abundance table
| sample | batch | status |
|---|---|---|
| sampleA | 0 | control |
| sampleB | 1 | treatment |
| sampleC | 0 | control |