Pipeline Catalog: Single-Cell Sequencing
Uploading Data
In addition to the FASTQ files for the single-cell sequencing data, a sample sheet (named
samplesheet.csv) must be provided which indicates what information is contained in each file.
The sample sheet should be a CSV file with the following columns:
sample: the name of the sequencing library (e.g. SampleA_GEX)fastq_1: the path to the Read 1 FASTQ file (e.g. SampleA_GEX.R1.fastq.gz)fastq_2: the path to the Read 2 FASTQ file (e.g. SampleA_GEX.R2.fastq.gz)feature_types: the type of feature data contained in the sample (e.g. Gene Expression)grouping: a grouping identifier for the sample (e.g. SampleA)
The
groupingcolumn is used to match up which GEX and VDJ FASTQs should be analyzed together. By including this column, a dataset can be analyzed which contains multiple groups of samples which should be analyzed independently.
For example:
sample,fastq_1,fastq_2,grouping,feature_types
SampleA_GEX,SampleA_GEX.R1.fastq.gz,SampleA_GEX.R2.fastq.gz,SampleA,Gene Expression
SampleA_VDJ,SampleA_VDJ.R1.fastq.gz,SampleA_VDJ.R2.fastq.gz,SampleA,VDJ
The different options for the feature_types column are:
Gene ExpressionVDJVDJ-TVDJ-BAntibody CaptureCRISPR Guide CaptureMultiplexing CaptureChromatin Accessibility
Forget to upload a sample sheet? No problem! You can upload it later by clicking on the "Upload Samplesheet" button for the dataset.
10X Single Cell Sequencing (cellranger)
Single-cell sequencing data produced by the 10X platform can be analyzed using the CellRanger software suite produced by that company.
The CellRanger software suite can be run in many different ways, to account for all of the different ways that data can be collected from single cells.
Analysis options include:
- Gene Expression Only
- VDF (T- or B-cells) Only
- Fixed RNA Profiling
- Gene Expression + VDJ and/or Antibody Capture
- CellRanger Multiome ATAC + GEX
5' Cell Multiplexing: Analysis of data produced by the 5' Cell Multiplexing platform is supported using the approach shown here. Use the CellRanger Hashtagging workflow to analyze this data.
Note: If your dataset has one set of reads which contains both the 5' Cell Multiplexing tags as well as feature barcode data, those files should be marked as
Multiplexing Capturein thefeature_typescolumn of thesamplesheet.csv. If a Feature Reference CSV is provided to the analysis, then those reads will be processed as feature barcode data after demultiplexing.
Fixed RNA Profiling + Feature Barcodes: If your dataset contains both fixed RNA profiling data and feature barcode data, you can use the CellRanger Multi Analysis workflow to analyze it. Make sure to select the "Fixed RNA Profiling" checkbox in the workflow options and enter the appropriate probe barcode information.
Reference Genomes:
- Human reference (GRCh38) - 2024-A (and legacy 2020-A)
- Mouse reference (GRCm39) - 2024-A (and legacy 2020-A)
- Human (GRCh38) and mouse (GRCm39) reference - 2024-A (and legacy 2020-A)
- Human V(D)J reference (GRCh38) - 7.1.0 (and legacy 7.0.0)
- Mouse V(D)J reference (GRCm38) - 7.0.0
More Details
Workflow Repository: github.com/FredHutch/nf-cellranger-tools
Citations:
- CellRanger: 10X Documentation
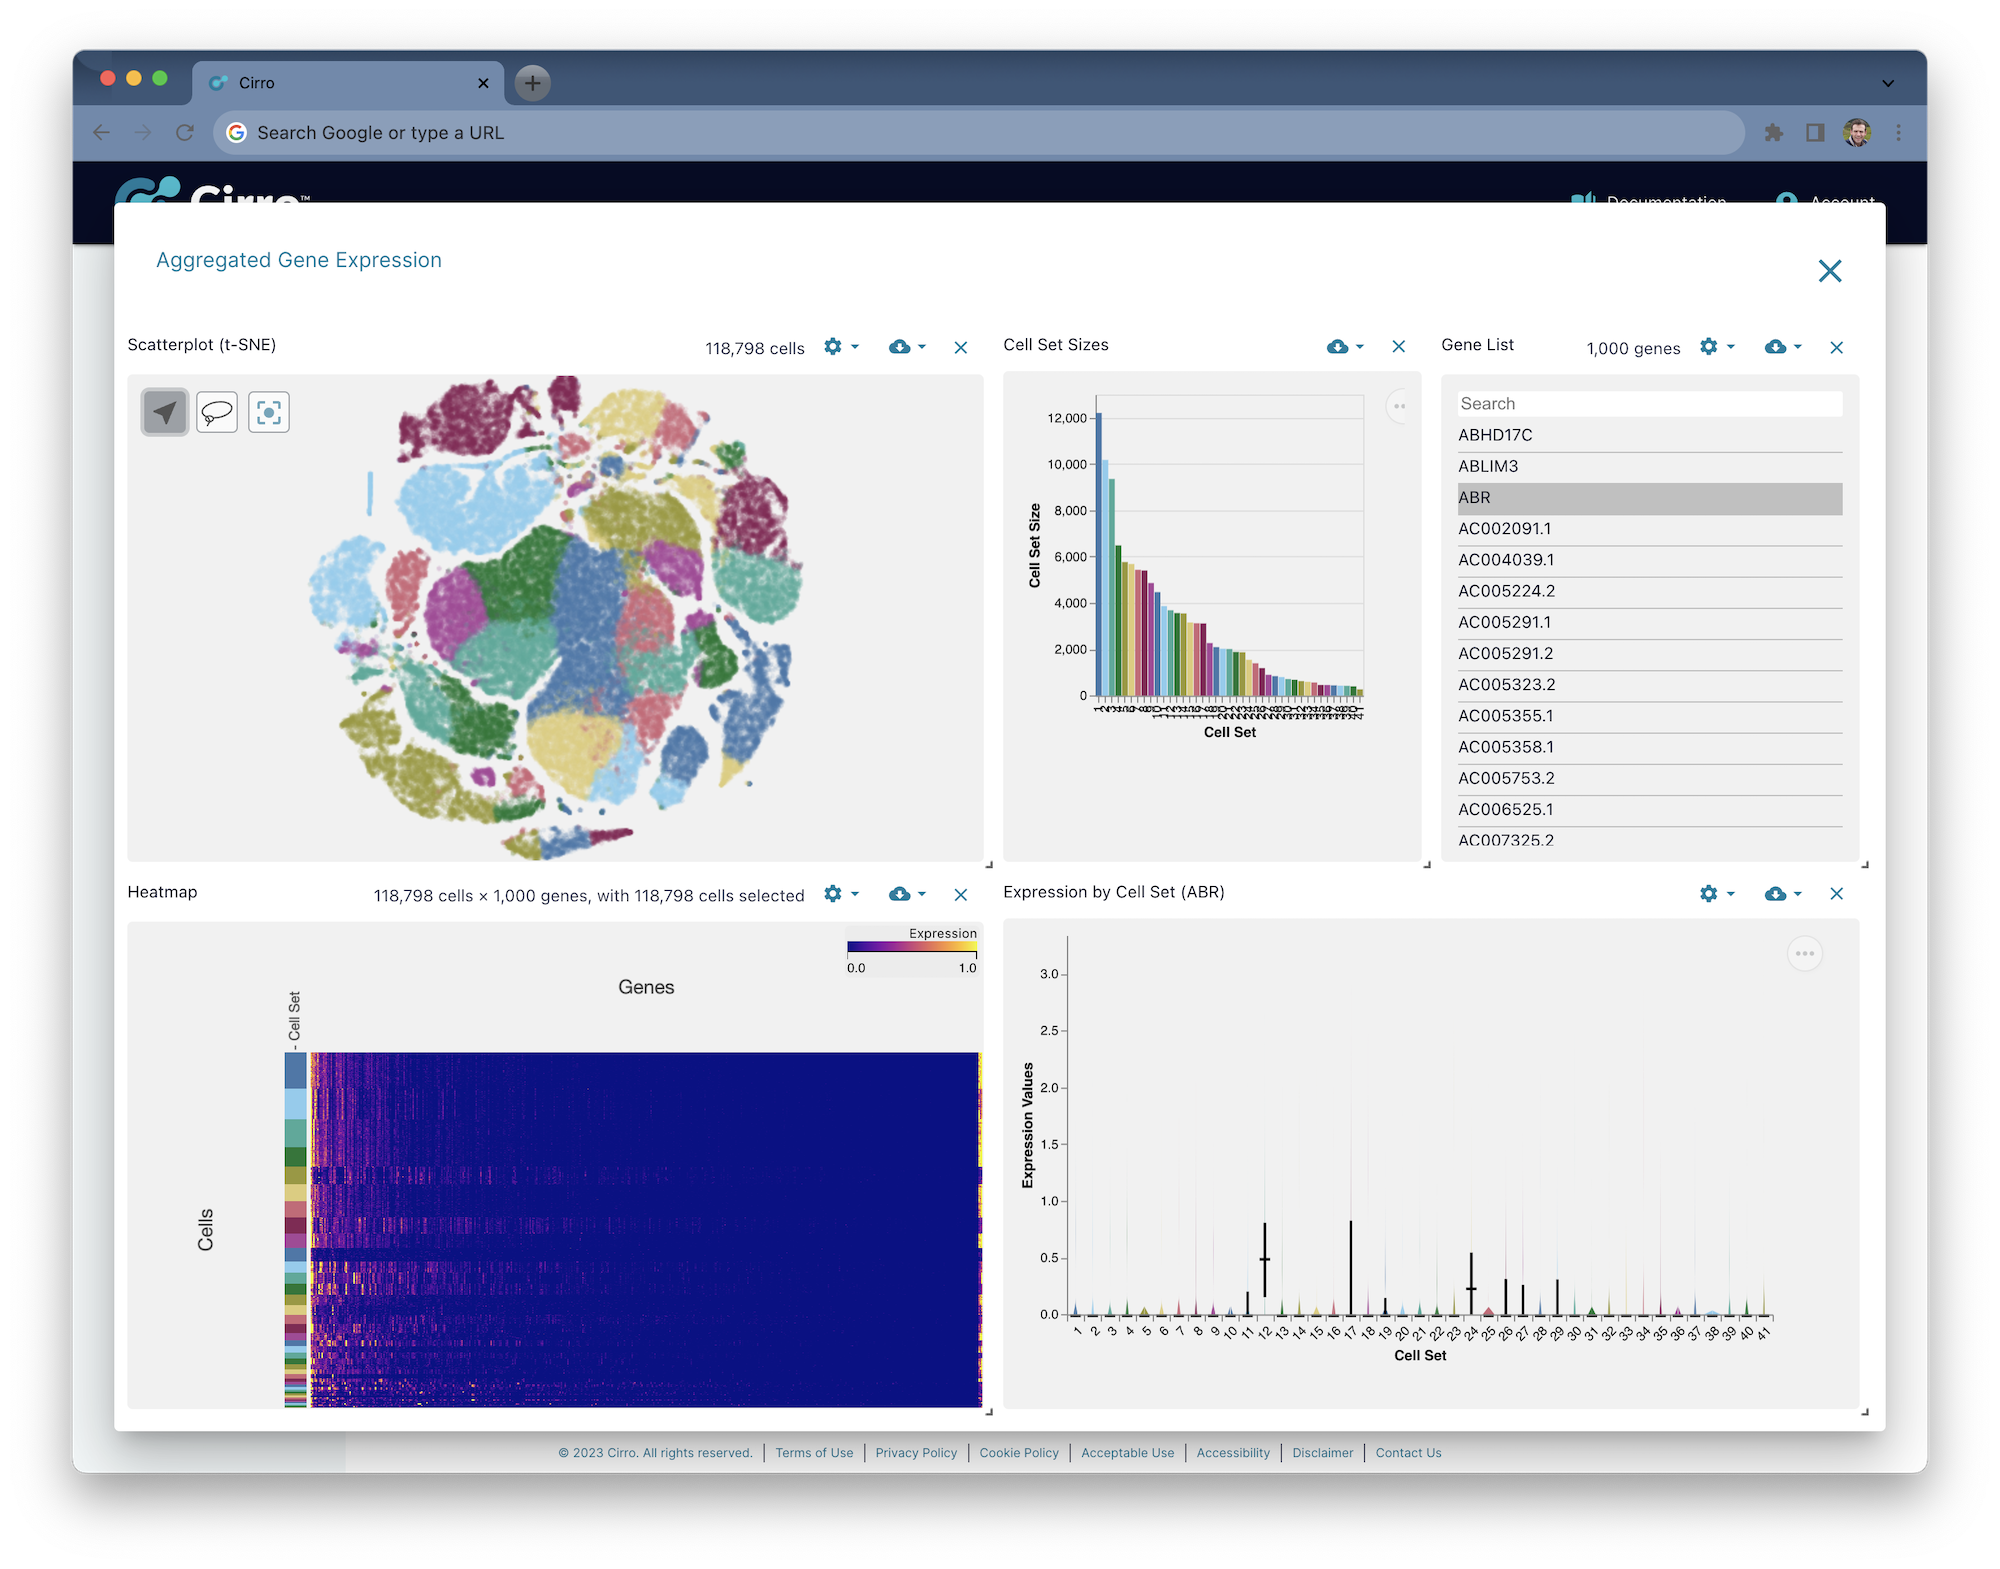
Visualization of Gene Expression
In addition to the summary images produced by CellRanger, the results of single-cell gene expression analysis can be visualized directly in Cirro using an interactive display. Visualizations which are available for a dataset can be opened by clicking on the button immediately above the file browser:
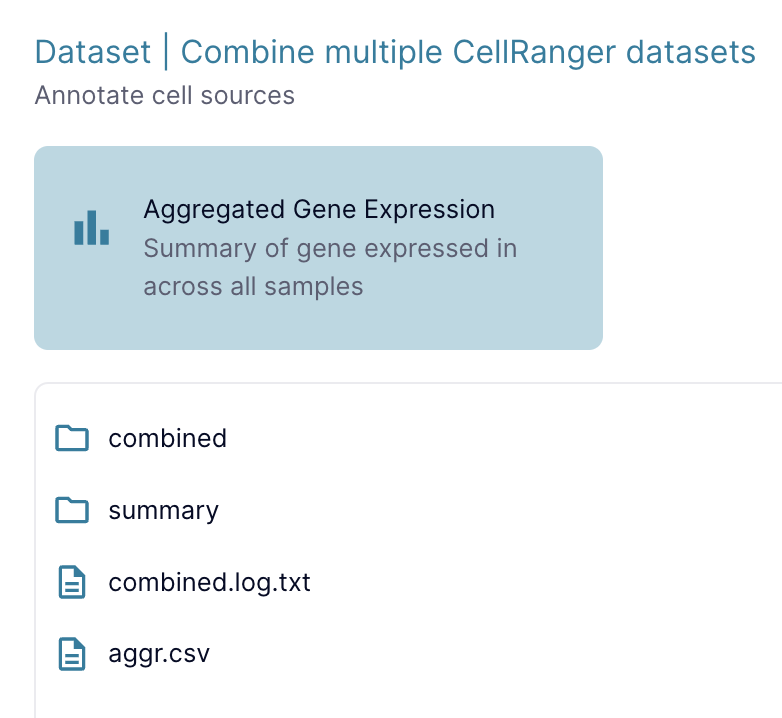
After selecting the dataset of interest, visualization will load directly in the browser:
CellRanger Gene Expression
CellRanger gene expression analysis can be performed for any sequencing data produced by Chromium Single Cell Gene Expression. The output of this analysis is a set of files summarizing the relative expression of each gene detected across each of the cells prepared in the sample.
Parameters:
- Transcriptome: Select the appropriate reference genome (human, mouse, or combined)
- Include Introns: Retain reads which align to intronic regions of genes
- CellRanger Version: Specify the CellRanger software version to be used for analysis
Technical Details
Workflow Repository: github.com/FredHutch/nf-cellranger-tools
Citations:
- CellRanger: 10X Documentation
CellRanger V(D)J
CellRanger V(D)J analysis can be performed for any sequencing data produced by Chromium Single Cell 5' V(D)J libraries. The output of this analysis is a set of files summarizing the reconstructed V(D)J alleles from each cell.
Parameters:
- Genome: Select the appropriate reference genome (human or mouse)
- CellRanger Version: Specify the CellRanger software version to be used for analysis
Technical Details
Workflow Repository: github.com/FredHutch/nf-cellranger-tools
Citations:
- CellRanger: 10X Documentation
CellRanger Multi Analysis
CellRanger multi analysis can be performed for any sequencing data produced with a combination of Chromium Single Cell Gene Expression with other modalities including 5' V(D)J, Antibody Capture, or CRISPR Guide Capture.
The implementation of cellranger multi provided in this workflow does not currently
support CMO multiplexing - please reach out to support@cirro.bio
if you have an interest in CMOs.
Uploading Data:
Input FASTQ data must be annotated to indicate which files contain each type
of library using the samplesheet.csv approach shown above.
This information will be used to automatically construct the config CSV required
by cellranger multi.
Feature References:
When analyzing Antibody Capture or CRISPR Guide Capture data, you must provide the appropriate
Feature Reference CSV file.
First upload that file to Cirro from the References page as the
CellRanger Feature Reference (CSV) file type.
Make sure to provide an appropriate name for the reference CSV which you upload.
Then, when launching an analysis of CellRanger Multi, select the reference appropriate
for that dataset.
Fixed RNA Profiling:
When analyzing data produced from Fixed RNA Profiling which also contains feature barcode data,
it can be analyzed using cellranger multi
as described here.
To enable this feature, select the "Fixed RNA Profiling" checkbox in the workflow options. If multiple samples were run in the same experiment, you can provide the probe barcode information in the form of CSV in the text box immediate below the checkbox.
For example:
sample_id,probe_barcode_ids,description
sample1,BC001+AB005,Control
sample2,BC002+AB006,Control
sample3,BC003+AB007,Case
sample4,BC004+AB008,Case
Parameters:
- Transcriptome: Select the appropriate reference genome (human, mouse, or combined)
- V(D)J Reference: Reference genome used for alignment of V(D)J data (human or mouse)
- Include Introns: Retain reads which align to intronic regions of genes
- Feature Reference: Select the Feature Reference CSV which has been uploaded to the References page (for either Antibody Capture or CRISPR Guide Capture)
- Fixed RNA Profiling: Click the "Enabled" checkbox if the dataset contains Fixed RNA Profiling data
- CellRanger Version: Specify the CellRanger software version to be used for analysis
Technical Details
Workflow Repository: github.com/FredHutch/nf-cellranger-tools
Citations:
- CellRanger: 10X Documentation
CellRanger Hashtagging
Cell Multiplexing (or cell hashing) is a method for pooling samples using sample-specific molecular tags. These tags help identify transcripts that originate from the same donor sample. Cell Multiplexing offers several advantages, including:
- Increased sample throughput in a single experiment
- Increased number of cells assayed in a single experiment
- Increased number of possible replicates in a single experiment
- Detection of cell multiplets and their removal before analysis
For more details on Cell Multiplexing, see the 10X Genomics documentation.
Hashtagging Requirements:
In order to analyze hashtagged data, the FASTQ files must be annotated using the samplesheet.csv
to indicate which ones contain the hashtag barcode sequences.
In addition, the multiplexing information must be provided to indicate which
barcodes were used for each sample.
This information will be used to automatically construct the config CSV required by cellranger multi.
FASTQ Information (samplesheet.csv):
When constructing the samplesheet.csv used to annotate the uploaded FASTQ files
(details on the samplesheet format), the feature_types column
must contain the value "Multiplexing Capture" for the FASTQs containing hashtag data.
If a dataset contains a single set of reads which contains both the 5' Cell Multiplexing tags as well as feature barcode data, those files should be marked as
Multiplexing Capturein thefeature_typescolumn of thesamplesheet.csv.
Sample Information (CSV):
To match each hashtag barcode to the corresponding sample, a CSV file
must be uploaded as a CellRanger Feature Reference on the Pipelines page.
This file should contain columns sample_id and cmo_ids, for example:
sample_id,cmo_ids
SampleA,Hash-tag1
SampleB,Hash-tag2
SampleC,Hash-tag3
SampleD,Hash-tag4
The sample information CSV file may be uploaded with any name, and will be selected by the user when launching the analysis.
Barcode Information (feature_reference.csv):
To provide molecular information about the hashtag barcodes, a feature_reference.csv
file must be provided which includes the Multiplexing Capture value as the
feature_type.
The full specification of this file can be found on the
CellRanger documentation, with an example shown below:
id,name,read,pattern,sequence,feature_type
Hash-tag1,Hash-tag1,R2,^NNNNNNNNNN(BC)NNNNNNNNN,GTCAACTCTTTAGCG,Multiplexing Capture
Hash-tag2,Hash-tag2,R2,^NNNNNNNNNN(BC)NNNNNNNNN,TGATGGCCTATTGGG,Multiplexing Capture
Hash-tag3,Hash-tag3,R2,^NNNNNNNNNN(BC)NNNNNNNNN,TTCCGCCTCTCTTTG,Multiplexing Capture
Hash-tag4,Hash-tag4,R2,^NNNNNNNNNN(BC)NNNNNNNNN,AGTAAGTTCAGCGTA,Multiplexing Capture
Because this hashtag information may be used for multiple datasets, it will be uploaded as a Pipeline Reference.
The barcode information CSV file may have any name, and will be selected by the user when launching the analysis.
Output:
The output of the hashtagging analysis will include the standard CellRanger outputs, including gene expression and V(D)J information if provided. Results will be provided for each individual sample which has been specified in the multiplexing table.
Technical Details
Workflow Repository: github.com/FredHutch/nf-cellranger-tools
Citations:
- CellRanger: 10X Documentation
CellRanger Flex
Fixed RNA Profiling data can be analyzed using the CellRanger software suite provided by 10X Genomics.
Barcodes
When analyzing 10X data produced by Fixed RNA Profiling, the barcode used
for each sample must be listed at the time of analysis.
This information will be used to automatically populate a configuration
CSV used by cellranger multi for analyzing this sample type.
Probe Sets
By default, the Chromium Probe Set v1.0.1 will be used for analysis.
Custom probe sets are also supported by this analysis workflow.
First upload the probe set CSV provided by 10X Genomics as a
Pipeline Reference, selecting
the type "CellRanger Probe Set (CSV)".
Then select that uploaded probe set when analyzing the associated
sequencing data.
Parameters:
- Reference Genome: Select the appropriate reference genome (human or mouse)
- Custom Probe Set: Optionally select a custom probe set to use for analysis
- Samples: List the samples used for each barcode (BC001, BC002, etc.)
- CellRanger Version: Specify the CellRanger software version to be used for analysis
Technical Details
Workflow Repository: github.com/FredHutch/nf-cellranger-tools
Citations:
- CellRanger: 10X Documentation
CellRanger Multiome ATAC + GEX
Analyze Single Cell Multiome ATAC + Gene Expression data using the CellRanger ARC software suite provided by 10X Genomics.
Input Data:
After processing a sample for Multiome ATAC + Gene Expression, raw sequencing data will be produced in the form of FASTQ files both for chromatin accessibility (ATAC) as well as gene expression (GEX) information. In order to analyze these datasets, the FASTQ files must be marked appropriately according to the data type that they represent.
The best way to annotate the input FASTQ data is using a samplesheet.csv
with columns for:
sample: Identifier for the sequencing libraryfastq_1: Name of the R1 (or I1) FASTQ filefastq_2: Name of the R2 (or I2) FASTQ filegrouping: Identifier for the sample analyzed for both GEX and ATACfeature_types: EitherGene Expression, orChromatin Accessibility
Example:
sample,fastq_1,fastq_2,grouping,feature_types
sampleA_gex,sampleA_gex_S1_L001_R1_001.fastq.gz,sampleA_gex_S1_L001_R2_001.fastq.gz,sampleA,Gene Expression
sampleA_atac,sampleA_atac_S2_L001_R1_001.fastq.gz,sampleA_atac_S2_L001_R2_001.fastq.gz,sampleA,Chromatin Accessibility
Note: The file described above should be named
samplesheet.csvand can be uploaded either (1) along with the FASTQ files during initial upload or (2) by clicking on the "Upload Samplesheet" button for a previously-uploaded dataset.
Parameters:
- Reference Genome: Select the appropriate reference genome (human or mouse)
- CellRanger ARC Version: Specify the CellRanger ARC software version to be used for analysis
Technical Details
Workflow Repository: github.com/FredHutch/nf-cellranger-tools
Citations:
- CellRanger: 10X Documentation
Multi-Sample Quality Control (scanpy)
The scanpy utility is a widely used tool for single-cell analysis in Python. This workflow uses a set of standard quality control metrics to filter cells and genes, while also combining multiple datasets into a single output.
Harmony is an efficient algorithm produced by the Broad Institute for integrating multiple data sets. The Python version of the Harmony algorithm (harmonypy) is used in this workflow to combine multiple datasets.
Input Data
The input data for this workflow is a set of single-cell datasets which have been produced
by the 10X platform.
In particular, the datasets should be in the form of .h5 files.
Datasets may be uploaded directly as "CellRanger Analysis Output" datasets, or they may be analyzed from the outputs of one of the CellRanger pipelines described above.
To properly combine cells from multiple datasets, each dataset needs to be annotated with a unique name. This can be done either by using a name which is embedded in the filename, or by providing a sample sheet CSV.
Sample names will be parsed from filenames using the patterns:
SAMPLENAME_filtered_feature_bc_matrix.h5, orSAMPLENAME_feature_bc_matrix.h5
If a file samplesheet.csv is provided in the input directory (or added after the dataset
is uploaded), the names in that file will be used instead.
The format of the samplesheet.csv file is:
sample,file
SampleA,fileA_filtered_feature_bc_matrix.h5
SampleB,fileB_filtered_feature_bc_matrix.h5
Note that when using a
samplesheet.csv, the filename does not need to contain the sample name in any way.
Supports combining input datasets in a single analysis.
Parameters
- Minimum Cells per Gene
- Minimum number of genes required for a cell to be considered
- Minimum Genes per Cell
- Minimum number of cells required for a gene to be considered
- Maximum Genes per Cell
- Maximum number of genes for a cell to be considered
- Percent Mitochondrial Cutoff
- Maximum percentage of mitochondrial reads for a cell to be considered
- Filter RBCs
- Remove red blood cells (RBCs) from the dataset (bool)
- Filter Platelets
- Remove platelets from the dataset (bool)
Analysis Steps
- Run Scrublet to identify doublets
- Calculate the percentage of reads which are mitochondrial or ribosomal
- Annotate cells which are platelets or red blood cells (RBCs) - Data saved at this step:
adata_combined.h5ad - Remove doublets
- Filter cells using a minimum number of genes (
min_genes) - Filter genes using a minimum number of cells (
min_cells) - Filter cells using a maximum percentage of mitochondrial reads (
percent_mito_cutoff) - Filter out RBCs (optional:
filter_rbc) - Filter out platelets (optional:
filter_platelets) - Filter cells on a maximum number of genes (
max_genes_cutoff) - Log transform the data (log1p) - Data saved at this step:
adata_allgenes_log1p.h5ad - Filter to highly variable genes
- Regress out the number of genes and the percentage of mitochondrial reads
- Scale the data (max_value=10)
- Perform PCA
- Use harmonypy for batch correction
- Perform UMAP, Louvain, and Leiden clustering - Data saved at this step:
adata_combined_harmony_hvg.h5ad
References:
- Wolock SL, Lopez R, Klein AM. Scrublet: Computational Identification of Cell Doublets in Single-Cell Transcriptomic Data. Cell Syst. 2019 Apr 24;8(4):281-291.e9. doi: 10.1016/j.cels.2018.11.005. Epub 2019 Apr 3. PMID: 30954476; PMCID: PMC6625319.
- Wolf FA, Angerer P, Theis FJ. SCANPY: large-scale single-cell gene expression data analysis. Genome Biol. 2018 Feb 6;19(1):15. doi: 10.1186/s13059-017-1382-0. PMID: 29409532; PMCID: PMC5802054.
- Korsunsky I, Millard N, Fan J, Slowikowski K, Zhang F, Wei K, Baglaenko Y, Brenner M, Loh PR, Raychaudhuri S. Fast, sensitive and accurate integration of single-cell data with Harmony. Nat Methods. 2019 Dec;16(12):1289-1296. doi: 10.1038/s41592-019-0619-0. Epub 2019 Nov 18. PMID: 31740819; PMCID: PMC6884693.
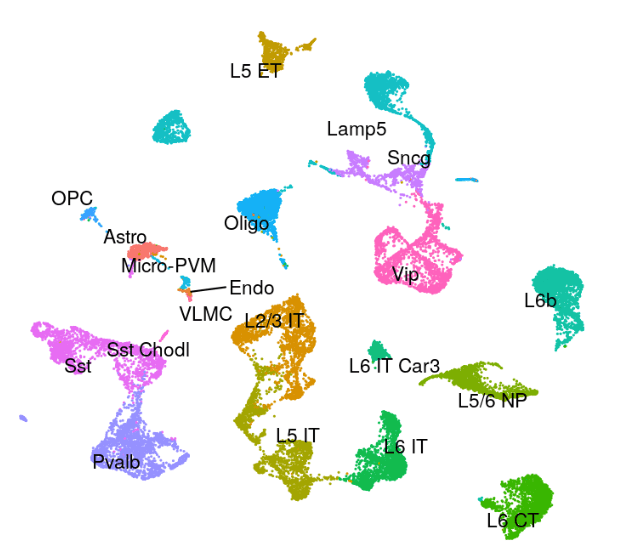
Single-Cell Azimuth Projection
Single-cell sequencing provides an incredibly detailed description of the genes being expressed by individual cells from a complex tissue. However, it can sometimes be difficult to interpret this information in a coordinated way across multiple specimens, analysis batches, or sampling modalities. The Satija lab published a reference-based approach (Azimuth), which projects newly collected datasets into the multidimensional space established for a set of curated tissue-specific atlases. This approach can be used to quickly annotate cell types and align UMAP ordinations for new datasets to facilitate rapid comparison.
The Azimuth analysis can be run on single-cell gene expression datasets in Cirro, and will produce as an output an updated Seurat (h5seurat) or Scanpy (h5ad) object which can be used for further downstream analysis.
Azimuth Human Motor Cortex Reference Atlas:
Azimuth References:
- Human Adipose -
adiposerefCells in Reference: 160,075 - Human Bone Marrow
bonemarrowrefCells in Reference: 297,627 - Human Fetal Development -
fetusrefCells in Reference: 377,456 - Human Heart -
heartrefCells in Reference: 656,509 - Human Kidney -
kidneyrefCells in Reference: 64,693 - Human Lung v2 -
lungrefCells in Reference: 584,944 - Human Motor Cortex -
humancortexrefNuclei in Reference: 76,533 - Mouse Motor Cortex -
mousecortexrefNuclei in Reference: 159,738 - Human Pancreas -
pancreasrefCells in Reference: 35,289 - Human PBMC -
pbmcrefCells in Reference: 161,764 - Human Tonsil -
tonsilrefCells in Reference: 263,299
Citation:
- Hao, Yuhan et al. “Integrated analysis of multimodal single-cell data.” Cell vol. 184,13 (2021): 3573-3587.e29. doi:10.1016/j.cell.2021.04.048
Aggregate CellRanger Outputs
Combine the results from multiple datasets with CellRanger aggr.
Many experiments generate data for multiple samples. Depending on the experimental design, these could be replicates from the same set of cells, cells from different tissues or time points from the same individual, or cells from different individuals. Samples could be processed through different Gel Bead-in Emulsion (GEM) wells or multiplexed within the same GEM well on Chromium instruments. The cellranger aggr pipeline can be used to aggregate samples from these scenarios into a single feature-barcode matrix.
When a single dataset in Cirro contains results from multiple samples, those results can be combined into a single set of outputs. This can be particularly useful when there is a need to project cells from multiple samples into the same t-SNE ordination and gene expression clusters.
Technical Details
Workflow Repository: github.com/FredHutch/nf-cellranger-tools
Citations:
- CellRanger: 10X Documentation
Visium: Spatial Transcriptomics
Spatial Transcriptomics datasets generated on the Visium platform with custom probes can be analyzed on Cirro using the Space Ranger software provided by 10X.
Probe Reference:
To get ready for running the analysis, build an analysis reference using the custom probes included in the analysis.
Steps:
- Upload the Visium sequencing data as a "10X Single-Cell (FASTQ)" dataset
- Upload the image files generated for those samples (see note below)
- Open the "Analyze Visium Spatial Transcriptomics" pipeline
- Run using the appropriate datasets for (a) FASTQs, (b) images, and (c) analysis reference
Images:
When uploading images, make sure to provide a samplesheet.csv file which matches
up the images to the appropriate sequencing dataset.
Use columns slide and area to include details on Visium
Slide Serial Number and Capture Area.
If those columns are omitted, then Space Ranger will be run with the
--unknown-slide parameter.
For example:
sample,file,slide,area
sampleA,sampleA_image.tif,V19L01-041,A1
sampleB,sampleB_image.tif,V19L01-041,B1
sampleC,sampleC_image.tif,V19L01-041,D1
Images can be provided for one of:
- CytAssist brightfield image
- Colorized image (TIFF or JPEG)
- Multi-channel, dark-background fluorescence image (TIFF)
- Single H&E brightfield image in either TIFF or JPG format
Technical Details
Workflow Repository: github.com/FredHutch/nf-cellranger-tools
Citations:
- SpaceRanger: 10X Documentation
Visium: Custom Probes
When analyzing Visium Spatial Transcriptomics data which has been prepared using custom probes, the reference genome must be combined with those probes prior to running that analysis.
Steps:
- Upload the custom probe(s) as a "Nucleotide Sequences (FASTA)" dataset (either in a single or multiple files)
- Open the "Build SpaceRanger Reference" pipeline and select the uploaded probes
- Select the appropriate reference genome (human or mouse) to combine with those probes
- Provide a memorable name for the custom reference and click "Run"
- Once the custom reference is finished building, it can be used with the "Visium Spatial Transcriptomics (Custom Probes) pipeline
Technical Details
Workflow Repository: github.com/FredHutch/nf-cellranger-tools
Citations:
- SpaceRanger: 10X Documentation
CITE-seq Total Variational Inference
scvi-tools (single-cell variational inference tools)
is an analysis package for end-to-end analysis of single-cell omics data primarily developed and maintained by the
Yosef Lab at UC Berkeley and the Weizmann Institute of Science.
totalVI (total Variational Inference) provides a flexible generative model of CITE-seq RNA and protein data that can subsequently be used for many common downstream tasks.
Inputs:
Combined RNA and protein data must be uploaded in the form of a
MuData multimodal data object (h5mu).
Batch correction will be performed on the data, and so the batch
information must be included in the input data as a column in the .obs.
After the input MuData file (h5mu) has been uploaded to Cirro, the "CITE-seq Total Variational Inference (scvi-tools/totalVI)" pipeline can be selected from the pipeline catalog.
Parameters:
- Protein Layer: Provide the key used for the protein data in the MuData object
- RNA Layer: Provide the key used for the RNA data in the MuData object
- Batch Key: Provide the key used for the batch information in the MuData object
Citations:
- Adam Gayoso, Zoë Steier, Romain Lopez, Jeffrey Regier, Kristopher L Nazor, Aaron Streets, Nir Yosef (2021), Joint probabilistic modeling of single-cell multi-omic data with totalVI, Nature Methods