Spatial regions
Spatial Regions
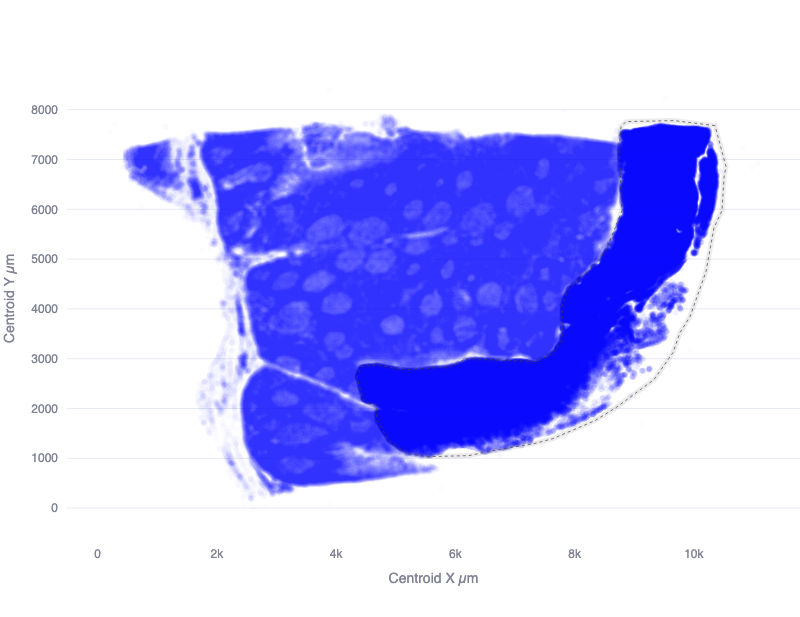
To analyze an experiment using spatial datasets, it is often necessary to define subregions of a particular dataset which should be compared against each other. One example of this is the use of tissue microarrays (TMA), where a collection of tissue cores are arranged in a grid for combined analysis. To analyze a dataset consisting of TMAs, it is necessary to define the region of each measurement (e.g. a Xenium run) which contains the specific TMAs of interest for a particular comparison.
The Quantitative Spatial Analysis (QSA) open source software project defines spatial regions using a simple JSON syntax which lists the X and Y coordinates of the vertices of a polygon that outline each region.
{
    "dataset": {
        "cirro_source": {
          "domain": "organization.cirro.bio",
            "project": "000000000-0000-0000-0000-000000000000",
            "dataset": "00000000-0000-0000-0000-000000000000",
            "path": "data/analysis-subfolder"
        },
        "type": "xenium"
    },
    "outline": [
        {
            "x": [
                1671.0085411393027,
                1497.2881668808081,
                1005.0804398150743,
                3431.375000292045,
                2811.7723321034155
            ],
            "xref": "x",
            "y": [
                4049.5208189474565,
                3861.008928715988,
                3528.3408871310435,
                4265.75504597767
            ],
            "yref": "y"
        }
    ]
}
While it is possible to construct these coordinates manually, it is recommended that the QSA app be used for this purpose.