Pipeline Catalog: Spatial Analysis
Spatial analysis of biological samples has been revolutionized by technological advancements in recent years including spatial transcriptomics (which was recognized as the Nature Method of the Year in 2020), spatial proteomics (the Nature Method of the Year in 2024), not to mention incredible advances in high resolution microscopy and imaging.
Uploading Spatial Data
Datasets primarily containing spatial datasets can be uploaded as either a general or specific dataset type, depending on the way in which the images were produced and the type of analysis which should be run on them.
Dataset Types:
Images: Multiplexed immunofluorescence images may be uploaded as this general TIFF format for processing via cell segmentation methodsXenium: 10X Genomics Xenium datasets may be uploaded and explored visually within CirroCosMx: Nanostring CosMx datasets may be uploaded and explored visually within Cirro
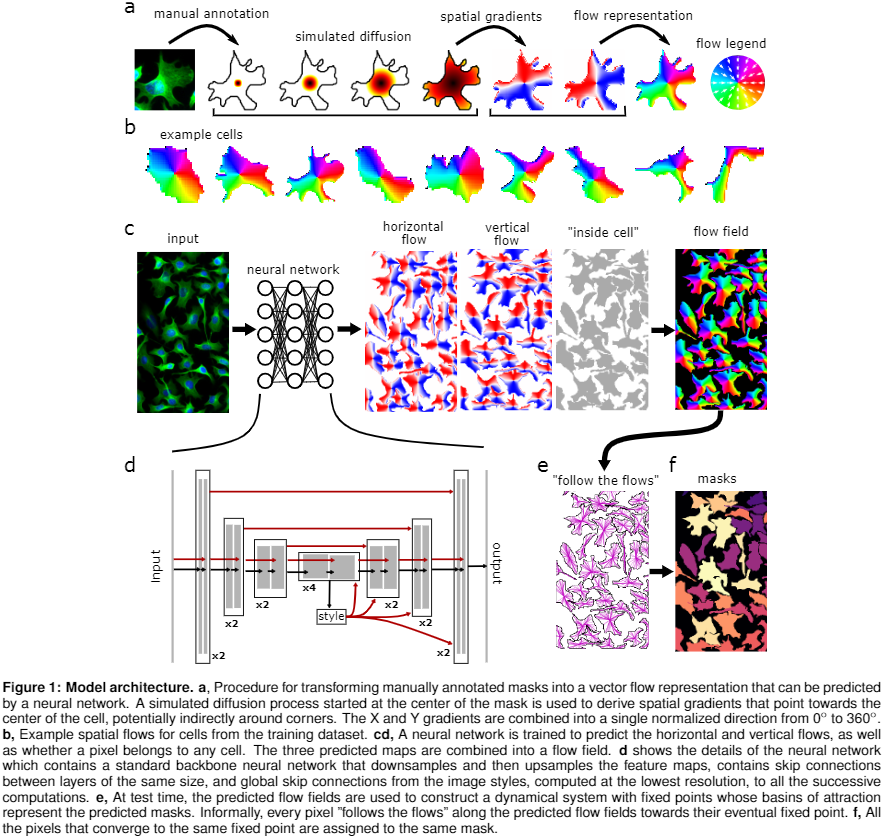
Cell Segmentation: StarDist
StarDist is a deep-learning-based method for the identification of cells from high-resolution microscopy images, developed by Martin Weigert and Uwe Schmidt.
StarDist2D Parameters:
threshold: Probability (detection) thresholdpixelSize: Resolution for detectionchannels: Detection ChannelcellExpansion: Approximate cells based upon nucleus expansioncellConstrainScale: Constrain cell expansion using nucleus size
Outputs:
measurements.csv: Spreadsheet with summary metrics for each of the detected cellscells.geo.json: Location of each detected cell in GeoJson format
Script:
The command executed by the workflow is:
def stardist = StarDist2D
        .builder(segmentationModel)         // Segmentation model
        .threshold(threshold)               // Probability (detection) threshold
        .normalizePercentiles(1, 99)        // Percentile normalization
        .pixelSize(pixelSize)               // Resolution for detection
        .channels(channels)                 // Detection channel
        .cellExpansion(cellExpansion)       // Approximate cells based upon nucleus expansion
        .cellConstrainScale(cellConstrainScale)     // Constrain cell expansion using nucleus size
        .measureShape()                     // Add shape measurements
        .measureIntensity()                 // Add cell measurements (in all compartments)
        .includeProbability(true)           // Add probability as a measurement (enables later filtering)
        .build()
Citations:
- Uwe Schmidt, Martin Weigert, Coleman Broaddus, and Gene Myers. Cell Detection with Star-convex Polygons. International Conference on Medical Image Computing and Computer-Assisted Intervention (MICCAI), Granada, Spain, September 2018.
- Bankhead, P. et al. QuPath: Open source software for digital pathology image analysis. Scientific Reports (2017). https://doi.org/10.1038/s41598-017-17204-5
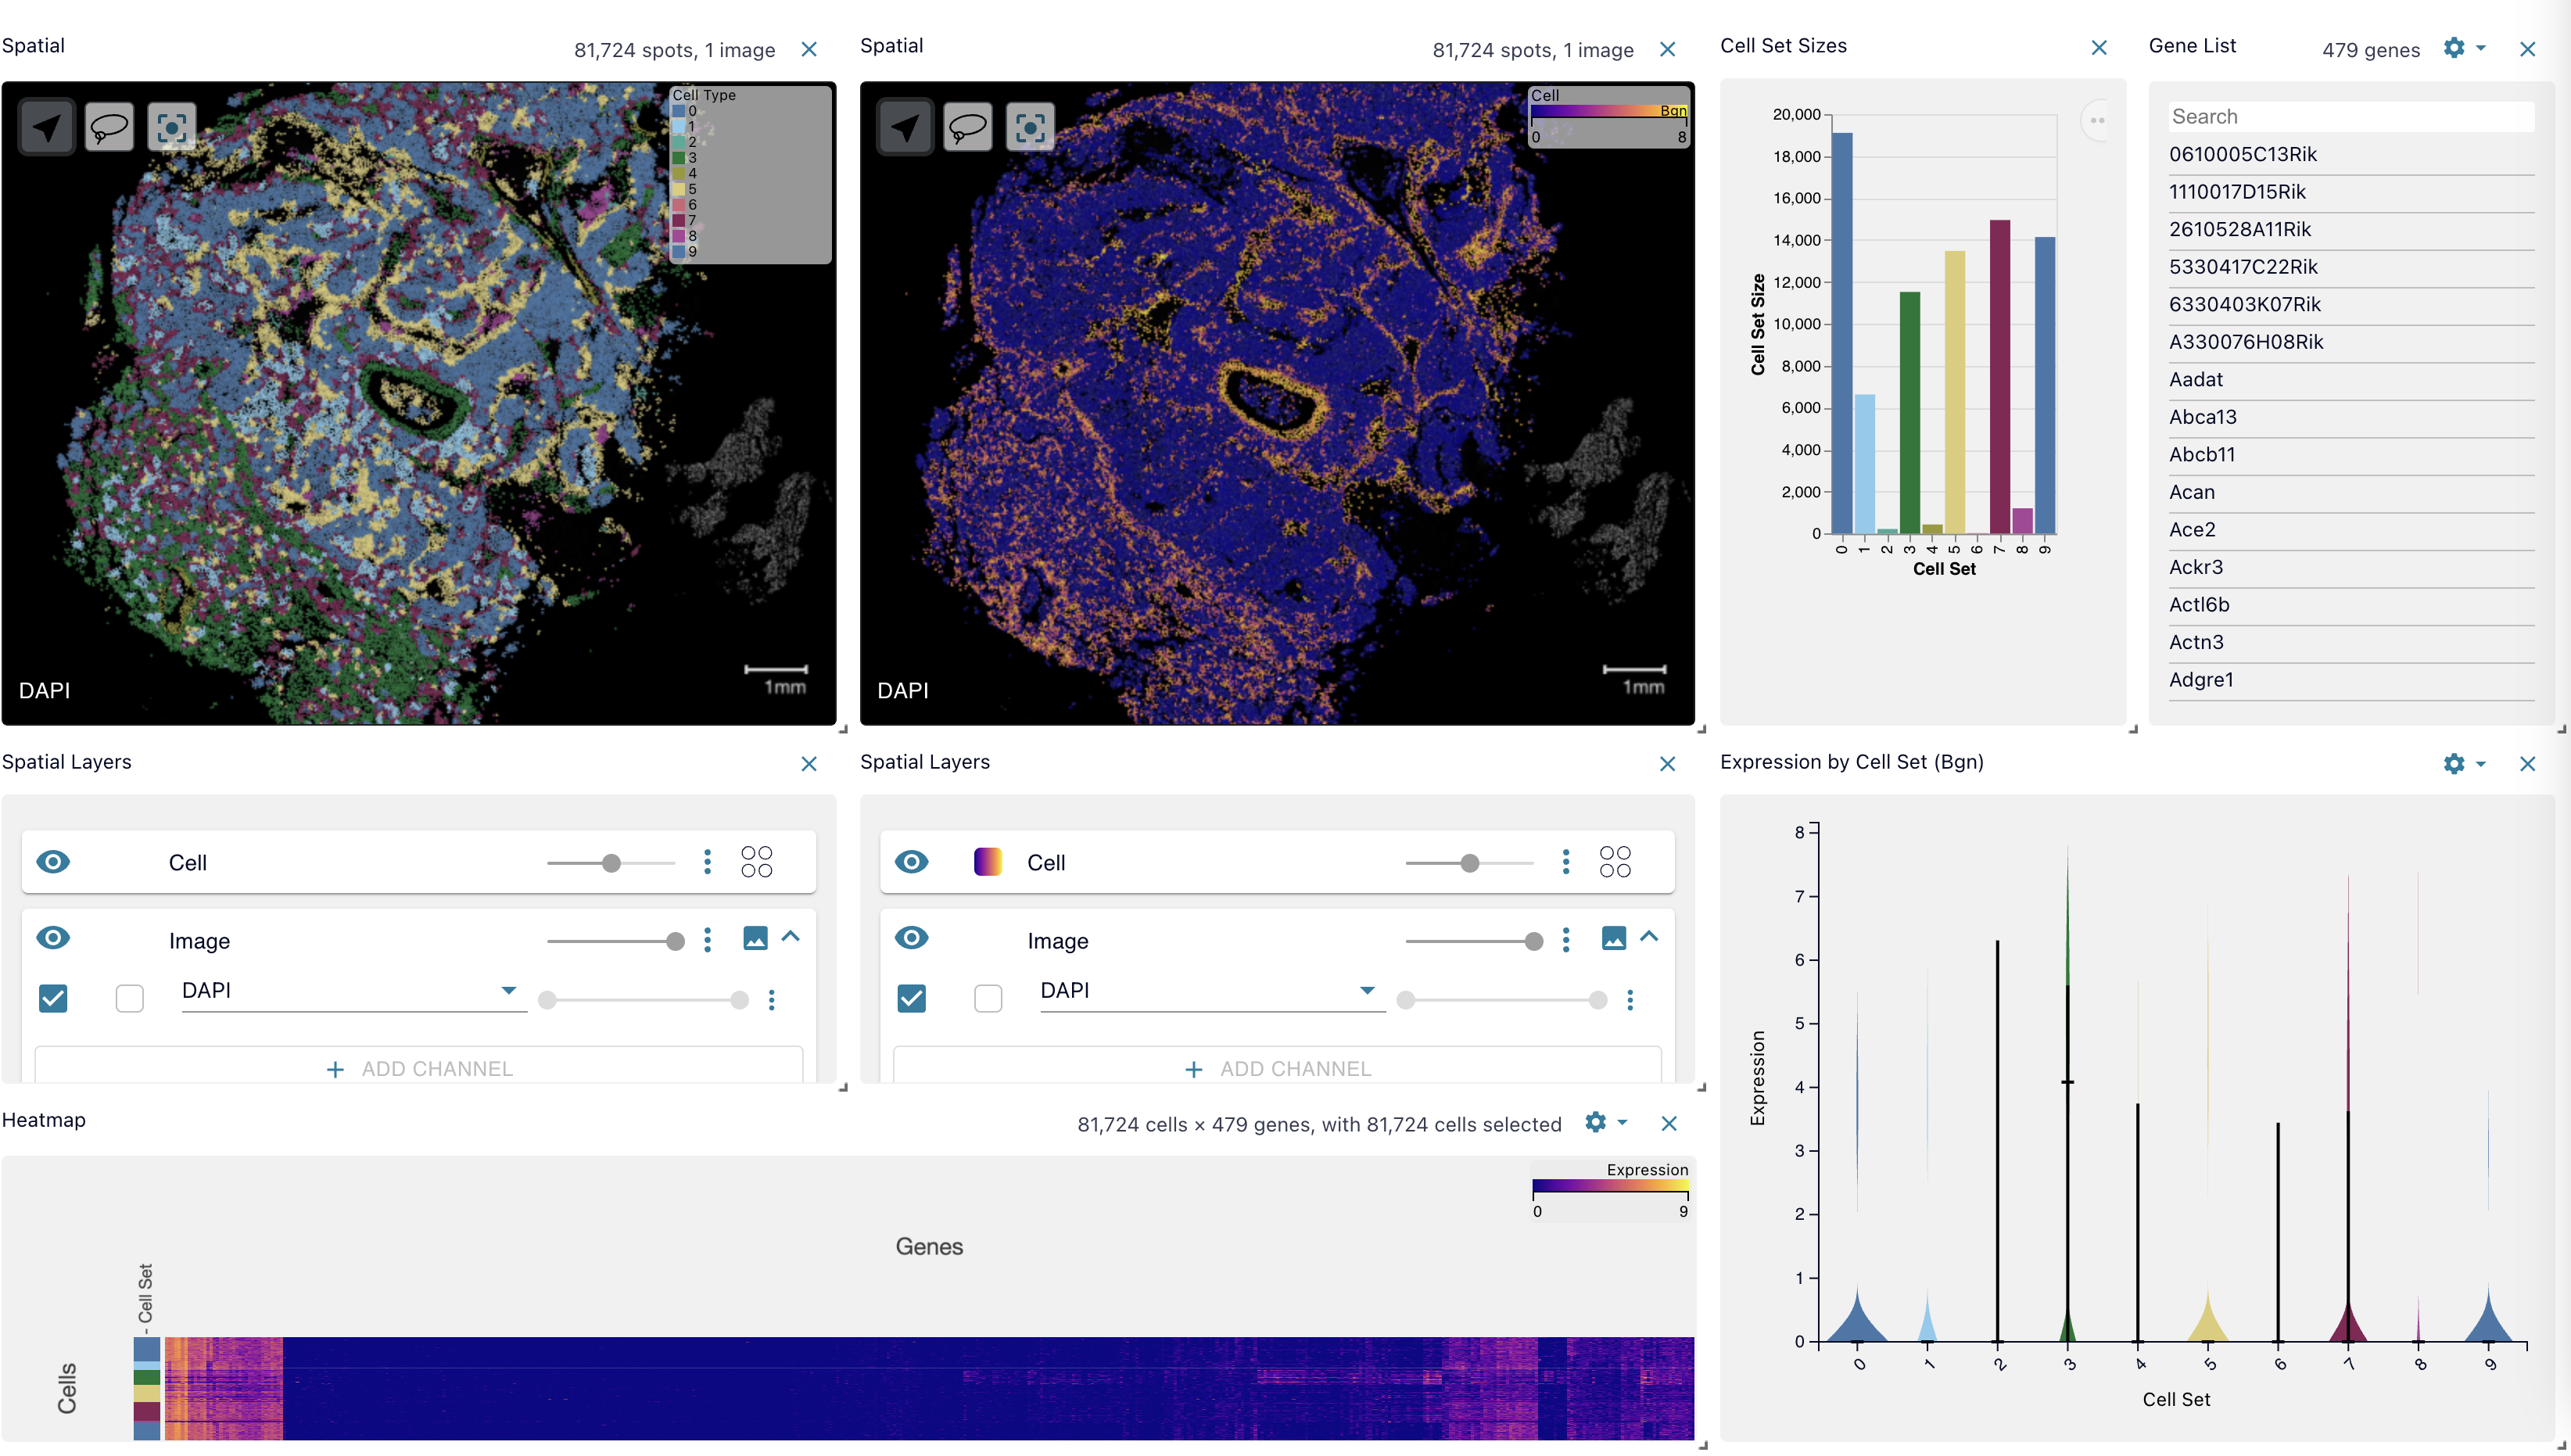
This pipeline supports viewing its output using the embedded Single-Cell Dashboard App directly on the output dataset's Overview page.
Cell Segmentation: Cellpose
Cellpose is an anatomical segmentation algorithm for the identification of cells from high-resolution microscopy images, developed by Carsen Stringer and Marius Pachitariu.
Cellpose Parameters:
- Pretrained Model: Pretrained model to use for segmentation (e.g. cyto3)
- Channel Axis: Axis of image with color channels (e.g. 0 if image is (C, X, Y))
- Channel to Segment: Channel to segment
- Nuclear Channel: Channel to segment nuclei (optional for cyto models)
- Cell Diameter: If 0, will use the diameter of the training labels used in the model, or with built-in model will estimate diameter for each image
- Flow Error Threshold: 0 turns off this optional QC step, higher values will remove more cells
- Cell Probability Threshold: Decrease to find more and larger masks
- No Resample: Disable dynamics on full image (makes algorithm faster for images with large diameters)
- Exclude on Edges: Discard masks which touch edges of image
- Z Axis: Axis of image which corresponds to Z dimension (optional)
- Anisotropy of volume in 3D: Anisotropy of volume in 3D
Outputs:
measurements.csv: Spreadsheet with summary metrics for each of the detected cellscells.geo.json: Location of each detected cell in GeoJson format
Citations:
- Stringer C, Wang T, Michaelos M, Pachitariu M. Cellpose: a generalist algorithm for cellular segmentation. Nat Methods. 2021 Jan;18(1):100-106. doi: 10.1038/s41592-020-01018-x. Epub 2020 Dec 14. PMID: 33318659.
- Pachitariu M, Stringer C. Cellpose 2.0: how to train your own model. Nat Methods. 2022 Dec;19(12):1634-1641. doi: 10.1038/s41592-022-01663-4. Epub 2022 Nov 7. PMID: 36344832; PMCID: PMC9718665.
- Pachitariu M, Stringer C. Cellpose3: one-click image restoration for improved cellular segmentation. bioRxiv 2024.02.10.579780.
This pipeline supports viewing its output using the embedded Single-Cell Dashboard App directly on the output dataset's Overview page.
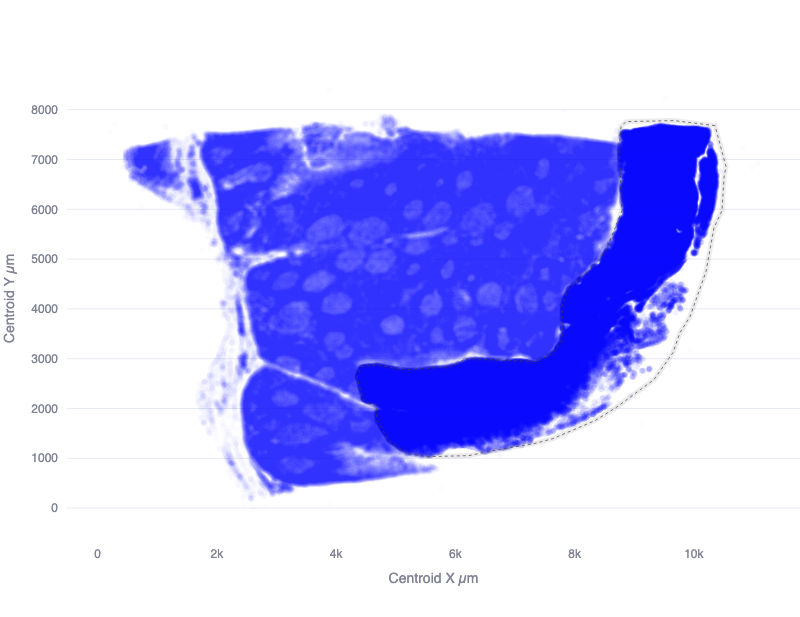
Spatial Regions
To analyze an experiment using spatial datasets, it is often necessary to define subregions of a particular dataset which should be compared against each other. One example of this is the use of tissue microarrays (TMA), where a collection of tissue cores are arranged in a grid for combined analysis. To analyze a dataset consisting of TMAs, it is necessary to define the region of each measurement (e.g. a Xenium run) which contains the specific TMAs of interest for a particular comparison.
The Quantitative Spatial Analysis (QSA) open source software project defines spatial regions using a simple JSON syntax which lists the X and Y coordinates of the vertices of a polygon that outline each region.
{
    "dataset": {
        "cirro_source": {
          "domain": "organization.cirro.bio",
            "project": "000000000-0000-0000-0000-000000000000",
            "dataset": "00000000-0000-0000-0000-000000000000",
            "path": "data/analysis-subfolder"
        },
        "type": "xenium"
    },
    "outline": [
        {
            "x": [
                1671.0085411393027,
                1497.2881668808081,
                1005.0804398150743,
                3431.375000292045,
                2811.7723321034155
            ],
            "xref": "x",
            "y": [
                4049.5208189474565,
                3861.008928715988,
                3528.3408871310435,
                4265.75504597767
            ],
            "yref": "y"
        }
    ]
}
While it is possible to construct these coordinates manually, it is recommended that the QSA app be used for this purpose.
Quantitative Spatial Analysis
The Quantitative Spatial Analysis (QSA) open source software project consists of (a) an interactive app used for selecting spatial regions from datasets including Xenium, CosMx, and segmented images, and (b) an analysis workflow used to compare a collection of spatial regions.
Note: If you encounted an error using this app, please create an issue with the its authors within the GitHub repository
The analysis of spatial regions using this workflow includes:
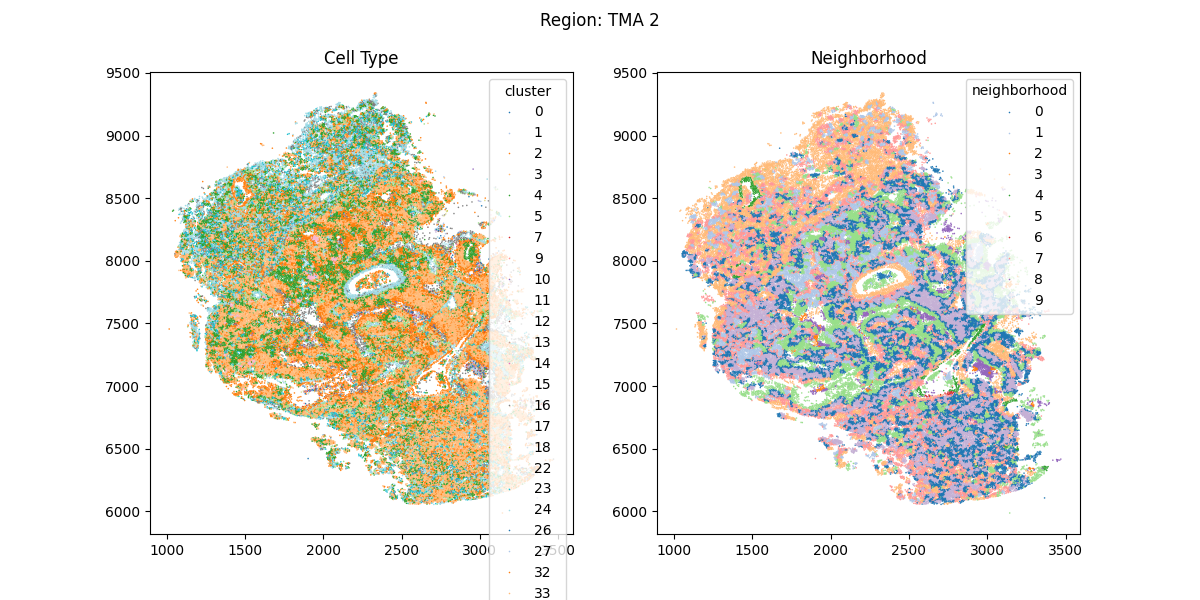
Cell Clustering
Unsupervised clustering is used to infer cell types directly from gene expression profiles using Leiden clustering. The user may modify the stringency of clustering by adjusting the leiden resolution parameter.
Cell Neighborhood Analysis
Using the k-nearest neighbors in spatial coordinates, cell neighborhoods are annotated using k-means clustering (as described in Schürch, et al. 2020). Practically, this results in the contiguous regions which contain similar combinations of cell types. The user may modify the stringency of cell neighborhood analysis by adjusting either the number of neighborhoods which will be returned, or the number of nearest neighbors to each cell which are considered in the clustering.
Outputs
For each region, the spatial coordinates of each cell are provided along with the cell type and neighborhood annotation for each.
It also includes an interactive display which allows the user to overlay the gene expression alongside those neighborhood and cell type annotations. This provides the ability to explore specific genes whose expression varies between cell types or across neighborhoods.
References
- Schürch CM, Bhate SS, Barlow GL, Phillips DJ, Noti L, Zlobec I, Chu P, Black S, Demeter J, McIlwain DR, Kinoshita S, Samusik N, Goltsev Y, Nolan GP. Coordinated Cellular Neighborhoods Orchestrate Antitumoral Immunity at the Colorectal Cancer Invasive Front. Cell. 2020 Sep 3;182(5):1341-1359.e19. doi: 10.1016/j.cell.2020.07.005. Epub 2020 Aug 6. Erratum in: Cell. 2020 Oct 29;183(3):838. doi: 10.1016/j.cell.2020.10.021. PMID: 32763154; PMCID: PMC7479520.
This pipeline supports viewing its output using the embedded Single-Cell Dashboard App directly on the output dataset's Overview page.