Pipeline Catalog: Image Analysis
Uploading Imaging Data
Datasets primarily containing image files can be uploaded as either a general or specific dataset type, depending on the way in which the images were produced and the type of analysis which should be run on them.
Dataset Types:
Images: General purpose (Analysis: QuPath)CODEX Images: Specific for mIHC on the CODEX platform (Analysis: MCMICRO or QuPath)
QuPath
QuPath is a flexible open-source analysis tool for imaging data. While the software suite can be used for interactive exploration as a desktop application, it can also be executed as a headless command-line application.
The process of converting a set of QuPath commands into a script is outlined in the extensive QuPath documentation.
To run a QuPath analysis in Cirro:
- Upload the image collection to Cirro as a dataset of the type "Images"
- Add the analysis script (see note below) as a reference
- Run the QuPath pipeline on the image dataset, selecting the uploaded script
QuPath Script Requirements
When working with images interactively in QuPath, it is very easy to prompt the user to select the input files of interest using a graphical interface. However, the QuPath user interface is not available when running in Cirro. Instead the analysis script should be set up to access input data from a known location.
All of the files from the input dataset will be staged in the working directory as inputs/.
An example snippet of code which will automatically generate a list of files from that directory with the .tif(f) extension is:
File folder = new File("inputs")
files = folder.listFiles().findAll {
    return it.isFile() &&
        !it.getName().endsWith('.ome.tif') &&
        (it.getName().endsWith('.tiff') || it.getName().endsWith('.tif'))
}
QuPath Optional Arguments
If a QuPath script requires any user input, it can be provided by the user as one or more "Optional Arguments".
The string provided by the user will be passed into the script using the
command-line syntax:
QuPath script --args {} (where {} will be replaced with
the exact string provided by the user).
Citations:
- Bankhead, P. et al. QuPath: Open source software for digital pathology image analysis. Scientific Reports (2017). https://doi.org/10.1038/s41598-017-17204-5
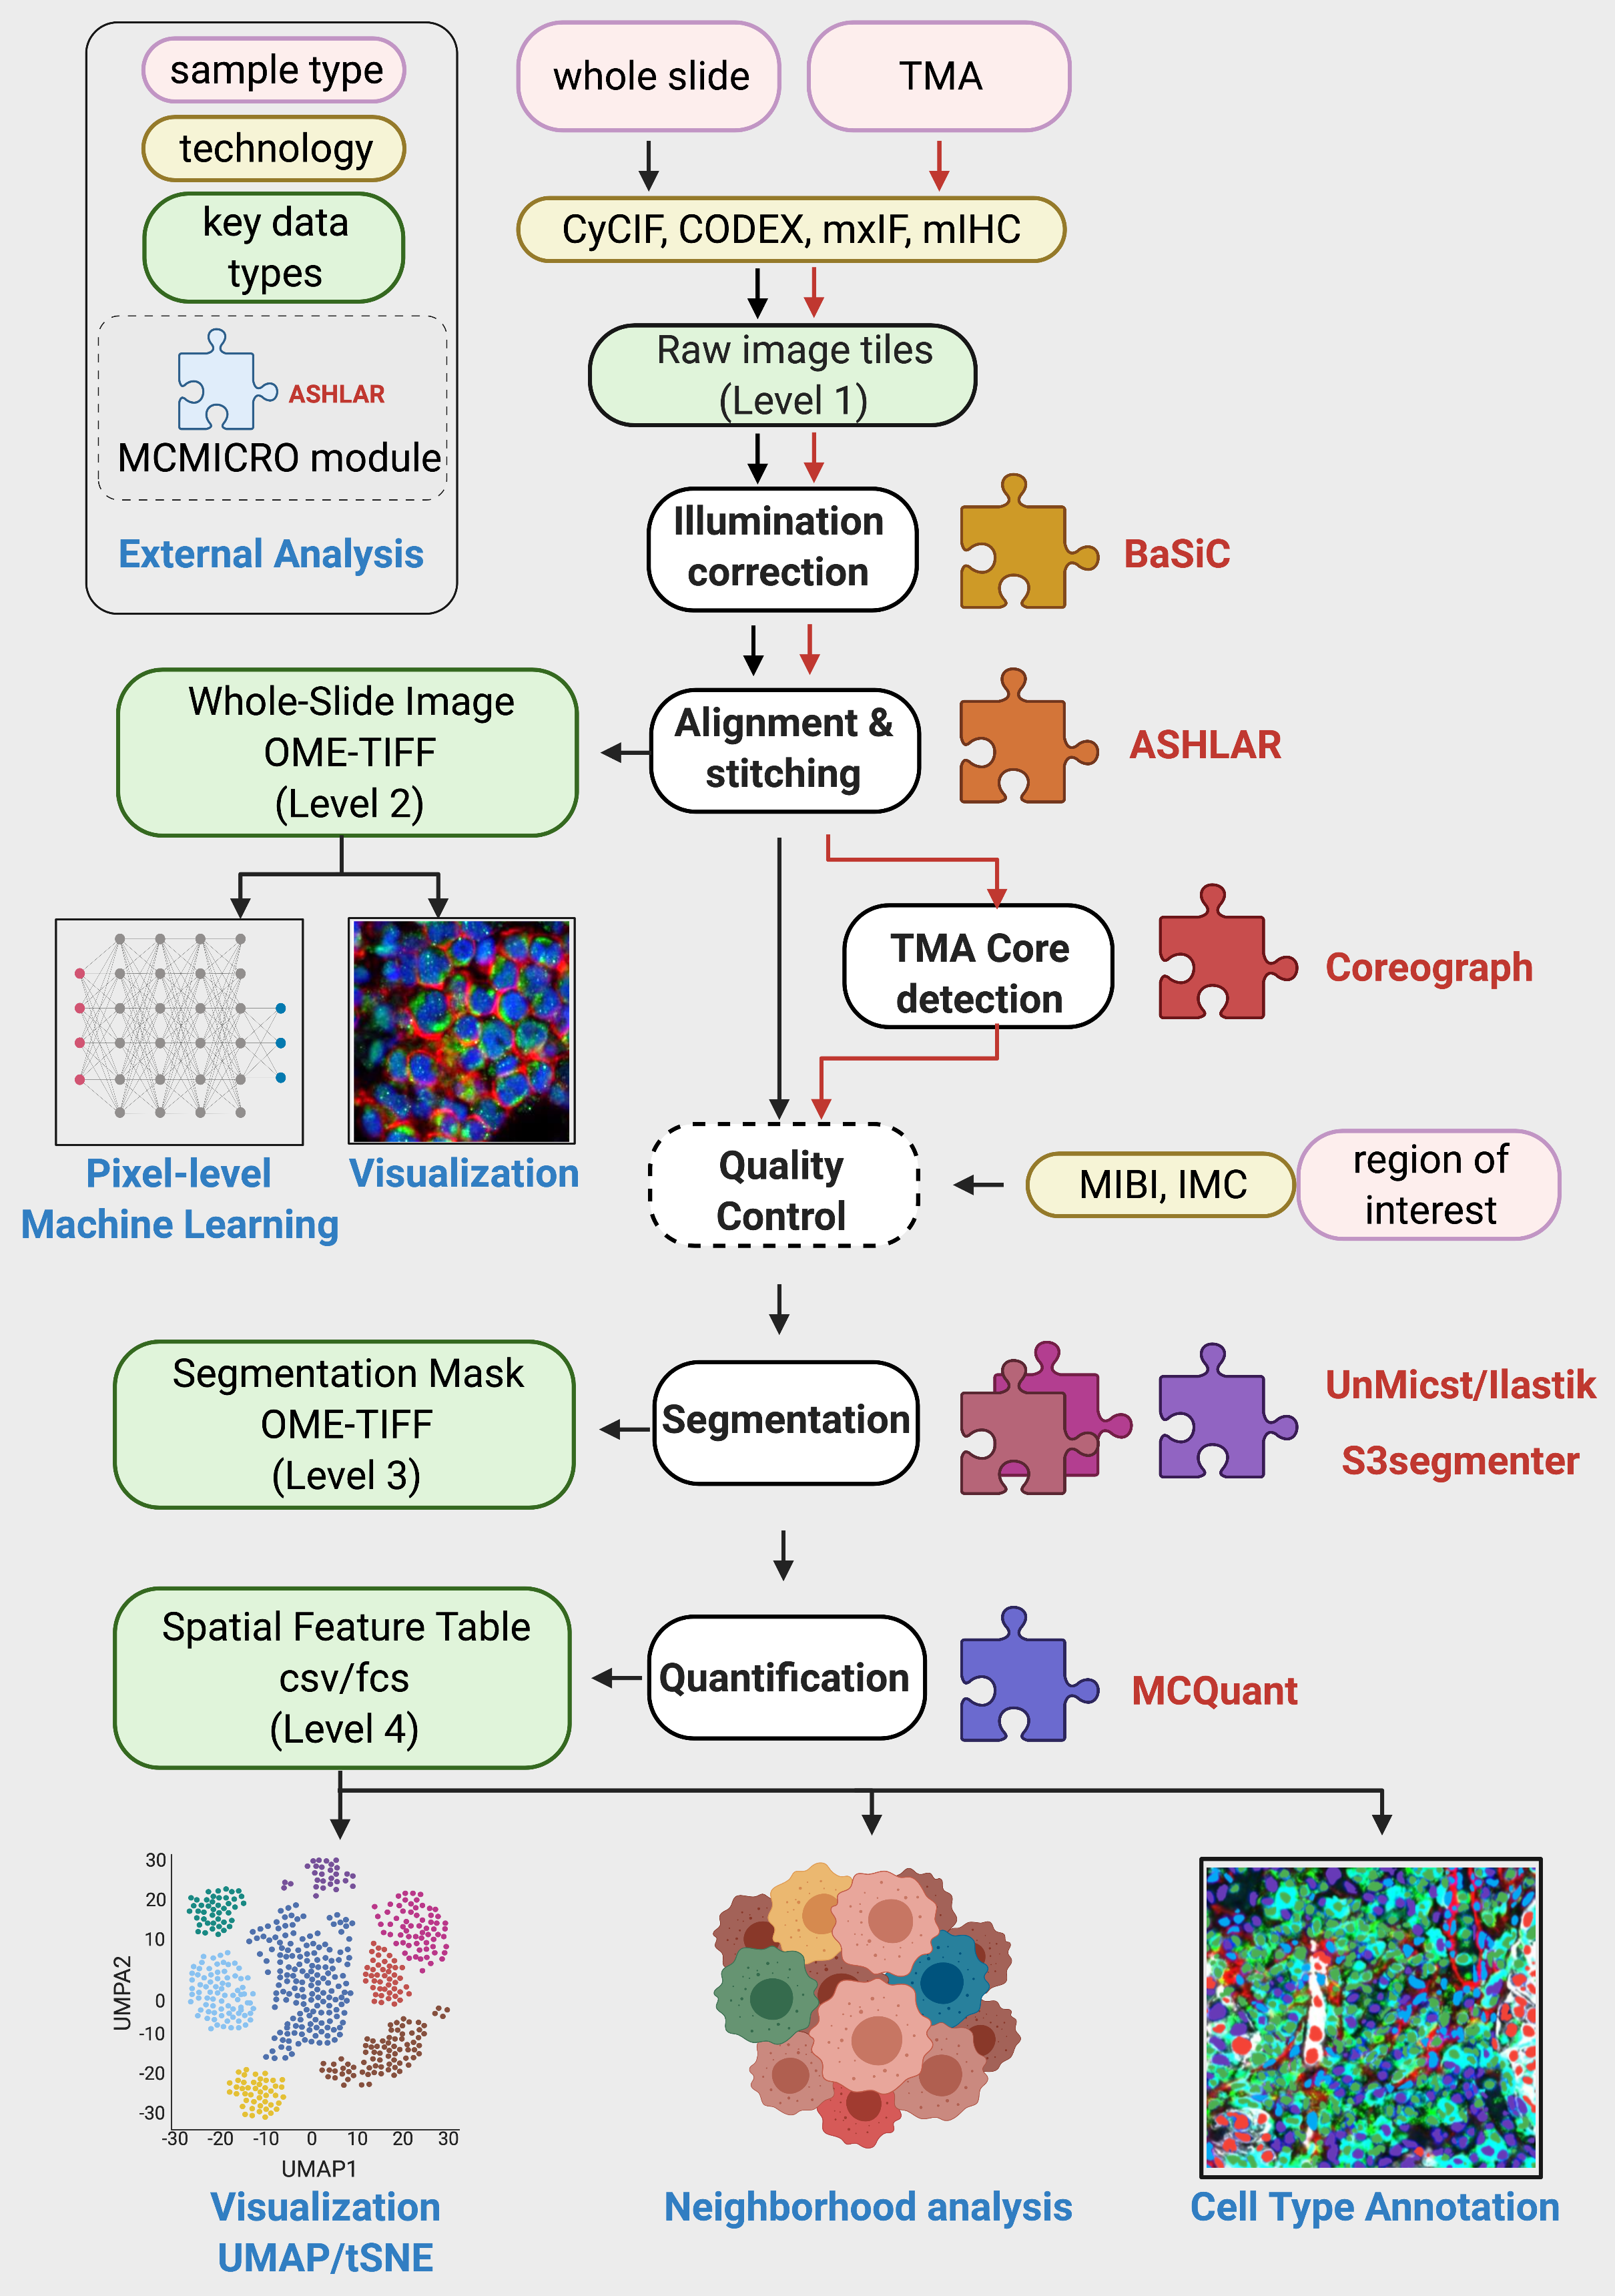
MCMICRO: Multiple-choice microscopy
MCMICRO is an end-to-end processing pipeline that transforms multi-channel whole-slide images into single-cell data.
Parameters:
- Image Type: Whole-Slide Image or Tissue Microarray
- Segmentation Tools: UnMICST, ilastik, and/or Cypository
- Downstream Modules: Scimap, naivestates, fastPG, scanpy, FlowSOM
Outputs:
The directory structure of the output files will follow the steps outlined in the figure above:
output_name
├── markers.csv
├── raw/
├── illumination/
├── registration/
├── dearray/
├── probability-maps/
├── segmentation/
├── quantification/
└── qc/
Multiplexed Tissue Image Analysis (Sage Bionetworks)
An automated workflow for generating visualizations of multiplexed tissue imaging datasets has been developed by Sage Bionetworks, originally for the HTAN Data Portal.
The nf-artist workflow:
- Converts bioformats files into OME-TIFF
- Sets thresholds for each channel and pepares 4-channel overlay groups using Auto-Minerva
- Renders a Minerva story using Minerva Author
- Renders a thumbnail image using Miniature
Inputs
Any image file may be processed which is recognized by Bio-Formats. H&E images are specified explicitly by the user when starting the analysis.
Output
The workflow outputs the following directory structure:
├── outdir
│   ├── <simpleName or id for first row of samplesheet>
│   │   ├── thumbnail.jpeg
│   │   ├── minerva
│   │   │   ├── index.html
│   │   │   ├── exhibit.json
│   │   │   ├── story.json
│   │   │   ├── Group-1
│   │   │   │   ├── tile1.jpeg
│   │   │   │   ├── ...
│   │   │   ├── Group-<n>
│   │   │   │   ├── tile1.jpeg
│   │   │   │   ├── ...
│   ├── < simpleName or id for n'th row of samplesheet>
Options
- remove_bg: Setting this to true will remove the non-tissue background. Default is true. (Type: Boolean)
- level: Specifies the pyramid level used in thumbnails. Default is -1 (smallest). (Type: Integer)
- dimred: The dimensionality reduction method used. Default is "umap". Options include "umap", "tsne", and "pca". (Type: String)
- colormap: Specifies the colormap used. Ensure the colormap is compatible with the number of n_components selected. Default is "UCIE". 3D colormap options: "UCIE", "LAB", "RGB". 2D colormap options: "BREMM", "SCHUMANN", "STEIGER", "TEULING2", "ZIEGLER", "CUBEDIAGONAL". (Type: String)
- n_components: Specifies the number of components. Default is 3. Options are 2 and 3. (Type: Integer)
This pipeline supports viewing its output using the embedded Minerva App directly on the output dataset's Overview page.